















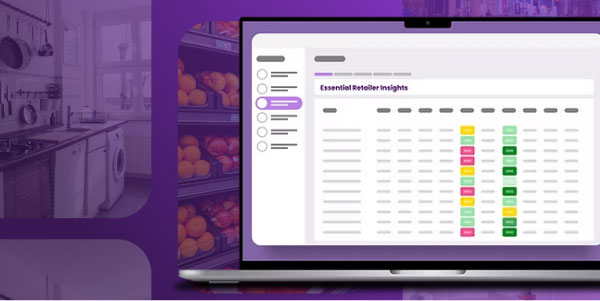



Circana’s new Purchase to Consumption solution makes that key connection. By linking purchase and consumption data for the same person, teams can get the full picture of what that shopper bought and how items were consumed.
Instead of guessing at what occasions drove sales or where share was lost, brands and retailers can effectively size up opportunities and prioritize their investments. That is especially important in the current operating climate, with intensifying competition and margins under pressure.
The Historical Consumption Blind Spot
The cost of the historical blind spot is higher now than ever, given that the U.S. food and beverage business is structurally flat. There are no untapped consumer segments left to discover — the entire population already eats. Population growth is low, birth rates have declined, and other macroeconomic and geopolitical trends are tamping down demand. In this environment, growth is a market-share game.
Success in this complicated market depends on finding untapped opportunities. Those opportunities include identifying and going after occasions where a brand is under-penetrated.
The Crucial Connector
Circana’s Purchase to Consumption solution links verified purchase behaviors with National Eating Trends® consumption data from the exact same individuals. This single-consumer linkage is new to the U.S. market, and it solves real problems.
Traditionally, metrics were separate. Circana measures roughly $1 trillion in annual spending on edible foods and beverages from retail, and its National Eating Trends research shows how many consumption occasions were sourced from retail. Teams often do simple math to estimate spending per occasion.
The new ability to replace “back of the napkin” estimates with an actual linkage provides brands and retailers with a wealth of information:
Daypart: Understanding spending at breakfast, lunch, dinner, and in-between moments.
Occasion: Seeing how much is spent when a specific need arises, not just what left the shelf.
Consumer group: Slicing results by demographics, geographies, and other dimensions in the consumption data.
Category and portfolio: Learning whether consumers use a product in a portable, on-the-go way or in a planned, at-home routine.
By moving to a verifiable quantitative measurement, teams can attach a real dollar value to the occasions that matter.
Occasion Dollars as a Planning and Prioritization Tool
“Occasion Dollars” is a measure that gauges the opportunity behind an occasion and lets teams view occasion behaviors down to the retailer level. In practice, it answers a direct question: Where are we getting our fair share of spending, and where are we not?
The lunch occasion is a good example of why this matters. Lunch remains the most disrupted daypart in a post-pandemic world. Consumers have returned to workplaces and are outside the home again, but that shift has not translated into more restaurant-sourced lunches. Traditional data might flag the disruption but can’t explain it.
Purchase to Consumption insights provide clarity on how the lunch occasion is fragmenting in several directions:
Consumers deploy ready-to-eat snack foods as a replacement lunch or as part of lunch.
Occasions migrate to other times of day, such as a mid-morning or late-afternoon moment.
"Snack" no longer means snack foods — the occasion may be filled by a nutritional drink, an energy drink, or coffee.
With Occasion Dollars, teams can quantify each of these moments, connect them to what is actually consumed, and determine whether a manufacturer or retailer is capturing its fair share. That turns a vague trend into a fundable plan, and it works in both directions. The same view that exposes upside also reveals where spend is underperforming, so teams know what to walk away from.
Uncovering Hidden Demand by Category
Using connected purchase and consumption data also surfaces demand that would otherwise stay hidden.
For example, Circana’s insights reveal that items that make it into school lunchboxes can be enjoyed at school as well as at home and during other away-from-home activities. The recent growth of chips, snack kits, apples, crackers, and yogurt signals demand for those items across locations and dayparts. The upward trajectory of these foods also underscores interest in products that are packable, portable, and convenient.*
For a brand, that data reeals priorities of families with younger children. Teams can then ask some strategic questions:
Where are families shopping for convenient snacks?
What are products that work for multiple away-from-home usage occasions? Which products and formats are especially hot right now?
When some brands and retailers are well developed at capturing an occasion and others are not, the gap becomes an opportunity to merchandise differently, market differently, and collaborate with vendors who bring occasion expertise.
Changing Strategic Decision-Making
The deepest change this capability delivers is to the conversation itself. Category and brand leaders can move from asking "What sold?" to asking "Which occasions drive growth?" That reframing changes where dollars go.
A useful way to see it is the consumer's value-step framework. Every meal decision sits somewhere on a spectrum:
Most affordable, most time-consuming: buy commodity goods at retail and scratch cook.
Middle steps: choose frozen solutions, heat-and-eat options, or deli-prepared foods that trade time for a modest premium.
Most convenient, most expensive: outsource the meal to a restaurant.
Circana’s Purchase to Consumption insights illuminate where consumers deploy dollars across each step. These insights are helpful to teams across an organization:
Sales teams use occasion sizing as proof points in retailer negotiations.
Category teams can uncover high-value consumption occasions to see if they can focus on additional occasions, dayparts, channels, or cross-merchandising partners
Marketing and media teams direct spend toward the moments with measurable upside.
Retail partners collaborate on merchandising and assortment for specific occasions.
Combined with other data, such as basket analysis, these insights can unlock even more opportunities in a connected information ecosystem.
Connecting the dots is a game-changing capability in a challenging operating environment, and is also helpful in stable economies. After all, the ability to know your consumer and discern growth opportunities is perennially pivotal.
*Source: Circana, Purchase to Consumption, School Year September 2025–June 2026, Weekdays, Kids/Teens 6–17 years old, Home/Retail Sourced Consumed at School