



top of page
Circana Navigation
Left Sidebar.jpg

Resources

Demand Signals Report

CPG Demand Signals Report

Monitoring the impact of macroeconomic factors, including tariffs, on volume, price, and supply on U.S. consumer behavior within the CPG Industry. 

New strategies and tactics.

Circana's official announcements.

Circana in the press.

Industry rankings vs. previous data period.

See how Circana can help your business grow.

Perspectives from our thought leaders.

A curriculum to address your needs.

Solving challenges that matter to you.

Thought leaders giving growth insights.

Consumer insights and buying trends.

pumpkin-latte.jpg

25-34-year-olds are

21%

more likely to drink pumpkin coffees than the average consumer

Quick Insight

It's that time of year again... pumpkin spice is back. 🎃☕


According to Circana, 25–34-year-olds are the most likely to enjoy pumpkin-flavored coffee, proving the season's signature sip is going strong.


Are you team “too early” or “right on time”?

Company

Solutions

Not sure where to start?

Uncover the right solution for your business in a few clicks.

Our Liquid Data® technology provides cross-industry data and advanced analytics in a single, open platform.

SOLUTIONS

Answer the most pressing business questions.

Designed for small CPG businesses. 

Curated reports and guided analysis.

Data and analytics for a single source of truth. 

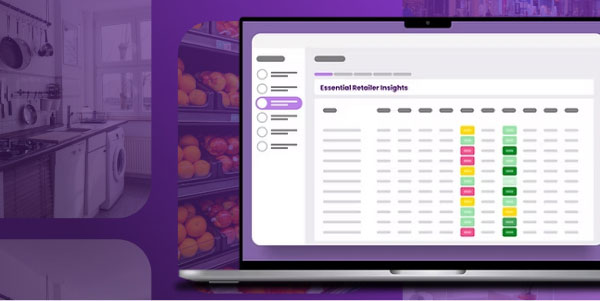
LDEssentials-Main.jpg

LIQUID DATA™ ESSENTIALS

When Your Data Speaks Retail

See performance the way retailers do without the need for a large team or budget. Built for small and mid-sized suppliers working with major retailers.

Suggested solutions

Liquid Data Go® helps small to midsize CPG brands grow faster and dream bigger.

Understand complex consumer behavior with clear, accurate insights into omnichan…

See performance the way retailers do without the need for a large team or budget…

Not sure where to start?

Uncover the right solution for your business in a few clicks.

Right Sidebar.jpg

Eating Patterns in America 2026: See How America Eats, Drinks, and Decides

By

Circana

Circana

Aug 6, 2026

Posted in:

Category

Circana’s 41st annual Eating Patterns in America report reveals how shifting consumer eating and drinking behaviors are reshaping food, beverage, retail, and foodservice. Based on $1.8 trillion in spending and 618 billion consumption occasions, it delivers a full view of in-home and away-from-home trends — with actionable insights to sharpen innovation, marketing, and activation strategy.

Solution-area_edited.jpg

Est. Read Time:

1

mins

You're reading:

Eating Patterns in America 2026: See How America Eats, Drinks, and Decides

Like it? Share it!

In This Article

Link
Link
Link
Writer: Circana
Circana
Aug 6
1 min read

Updated: Aug 14


What, when, where, and why America eats and drinks is changing — creating new challenges and opportunities for brands, retailers, and foodservice operators. Circana’s newest edition of Eating Patterns in America helps you decode these shifts and turn evolving consumer behavior into smarter growth strategies.


Now in its 41st edition, Eating Patterns in America 2026 brings together Circana’s view of U.S. consumption across more than $1.8 trillion in spending and 618 billion eating and drinking occasions, connecting in-home and away-from-home behaviors in one practical resource.


Use the report to:


  • Spot emerging behaviors before they become mainstream.

  • Prioritize the occasions, segments, and channels with the greatest potential.

  • Build more effective innovation, marketing, merchandising, and activation plans.


Powered by multiple integrated Circana datasets, the report delivers a 360-degree view of consumption across food and beverage, foodservice, broadline distribution, small appliances, housewares, and more.


Explore the video and complete the form to see how Eating Patterns in America 2026 can help your team turn insight into action.


Connect with us to learn more about EPA

Add a Title

About the author

View all solutions that

bottom of page