Industries



25-34-year-olds are
21%
more likely to drink pumpkin coffees than the average consumer
Quick Insight
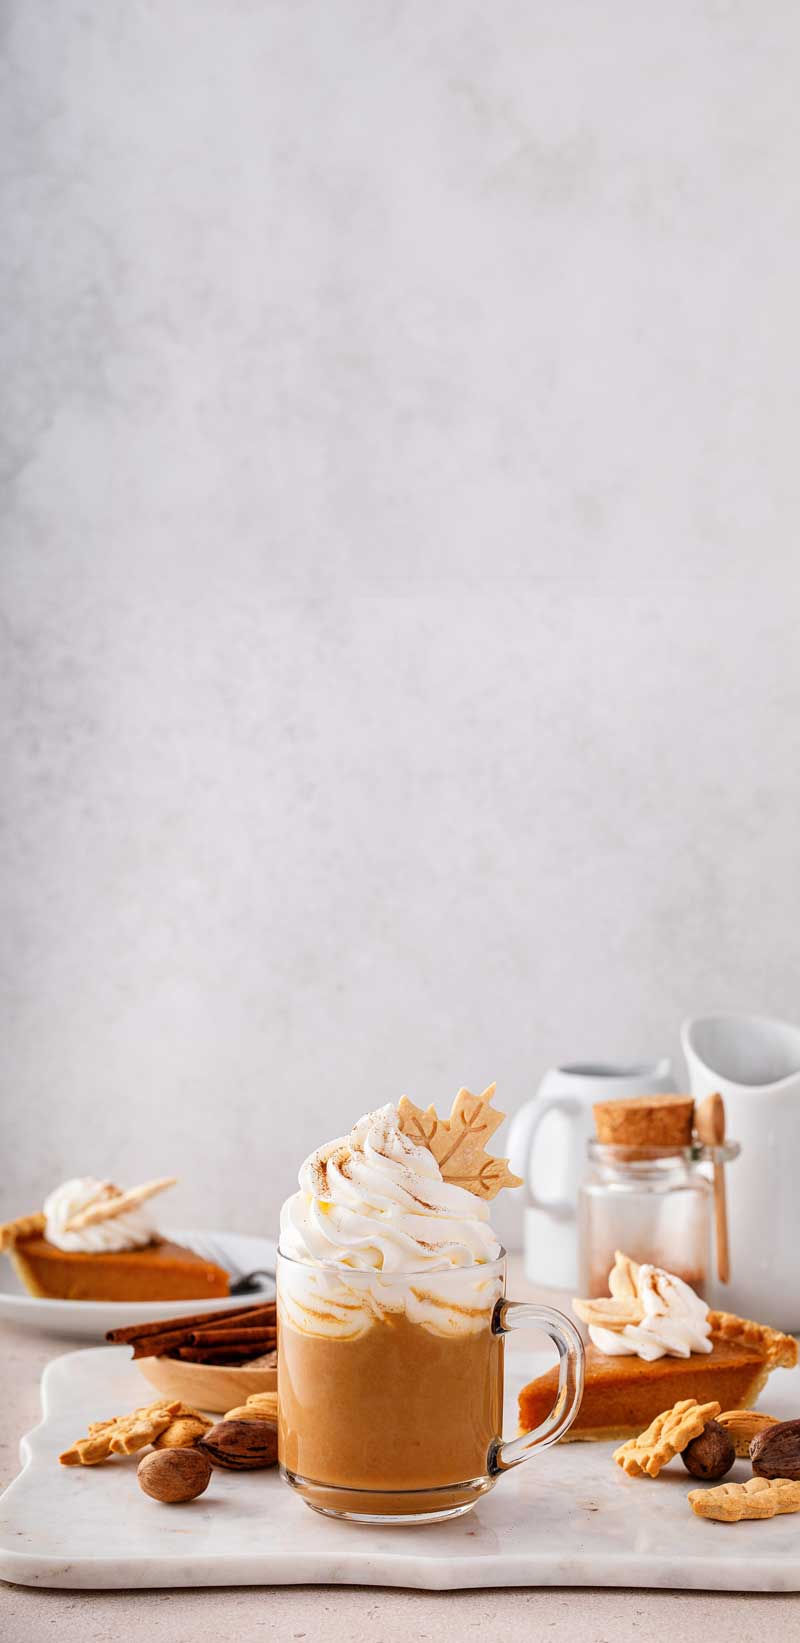
It's that time of year again... pumpkin spice is back. 🎃☕
According to Circana, 25–34-year-olds are the most likely to enjoy pumpkin-flavored coffee, proving the season's signature sip is going strong.
Are you team “too early” or “right on time”?
Company

Solutions

Track business performance against key competitors at every stage of the product lifecycle.
SOLUTIONS
We help our clients accelerate demand by focusing on the best opportunities for the greatest impact on their business.
SOLUTIONS
Our Liquid Data® technology provides cross-industry data and advanced analytics in a single, open platform.
SOLUTIONS

Resources










Suggested solutions




TERM
Brand Development Index (BDI)
Brand sales per capita in a market versus national average.
Definition
BDI compares a brand's per capita sales in a market to its national per capita sales, indexed to 100.
How to Calculate
Divide brand sales per capita in the market by national per capita, then multiply by 100.
Why it Matters
Identifies strong and weak markets for focus.
Key Advantages
Balances brand size with population differences.
Example
BDI of 120 means the brand over-indexes by 20 percent.
Use it to
Index brand sales in a market versus total to see where the brand over- or under-indexes. Target markets with low BDI for distribution or price corrections and protect high BDI markets from share erosion.