top of page
Circana Navigation
Left Sidebar.jpg
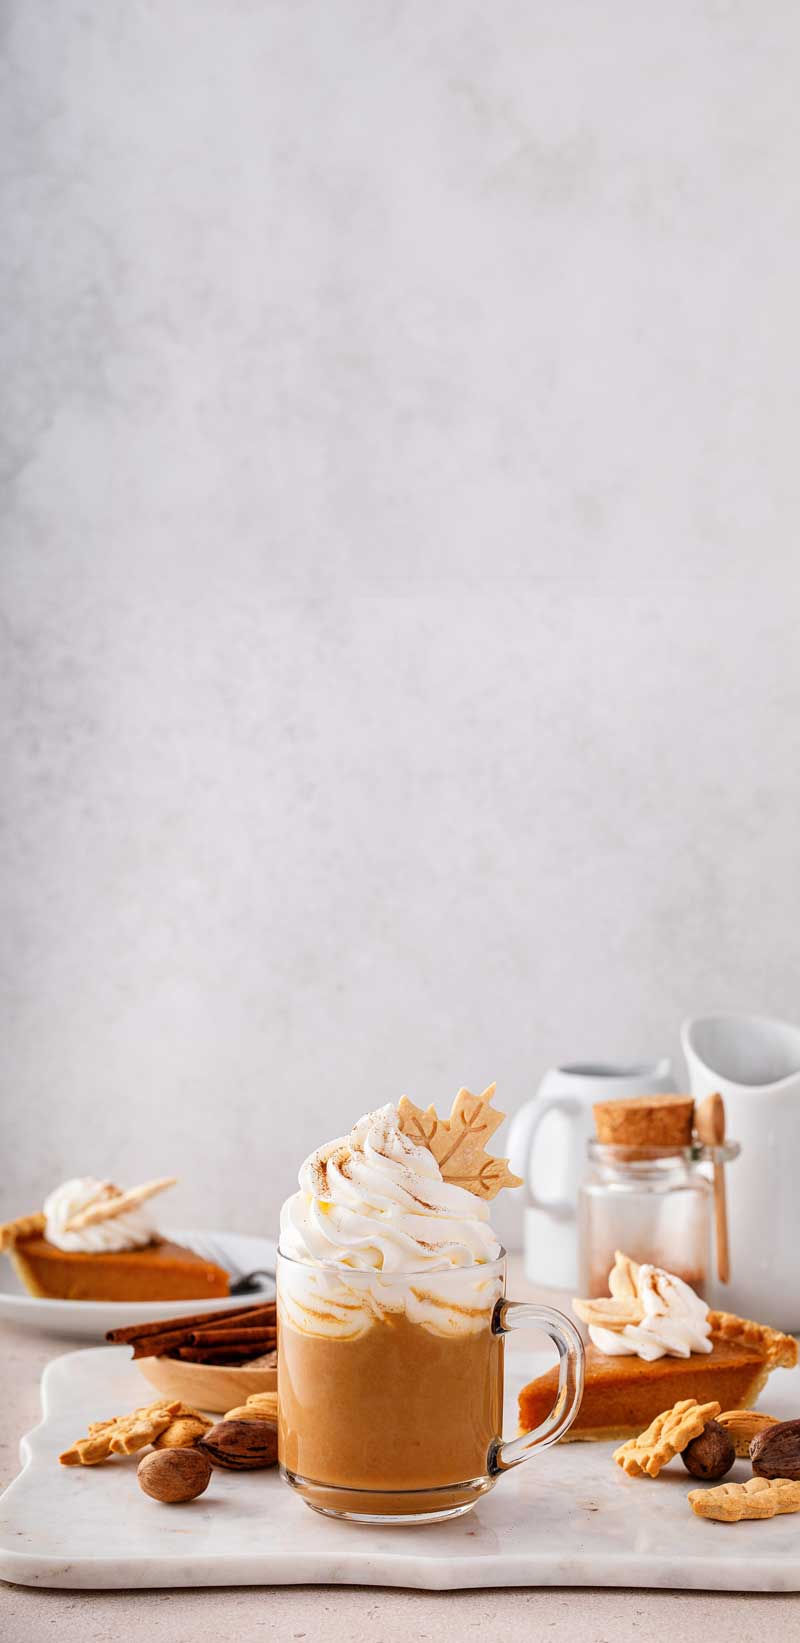
pumpkin-latte.jpg

25-34-year-olds are

21%

more likely to drink pumpkin coffees than the average consumer

Quick Insight

It's that time of year again... pumpkin spice is back. 🎃☕


According to Circana, 25–34-year-olds are the most likely to enjoy pumpkin-flavored coffee, proving the season's signature sip is going strong.


Are you team “too early” or “right on time”?

Company

Solutions

Not sure where to start?

Uncover the right solution for your business in a few clicks.

Our Liquid Data® technology provides cross-industry data and advanced analytics in a single, open platform.

SOLUTIONS
Answer the most pressing business questions.

Designed for small CPG businesses. 

Curated reports and guided analysis.

Data and analytics for a single source of truth. 

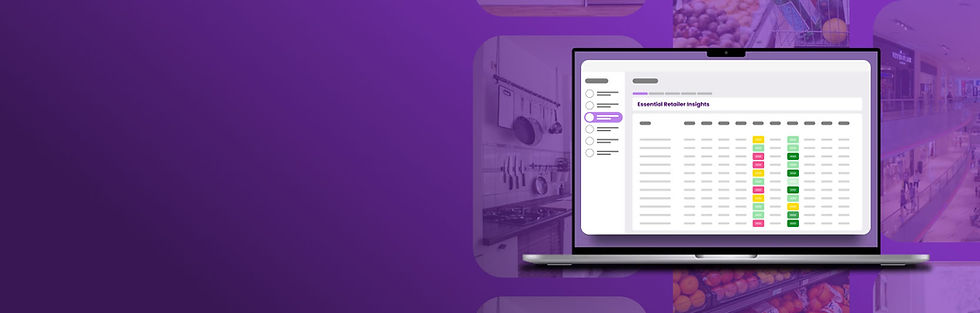
LDEssentials-Main.jpg

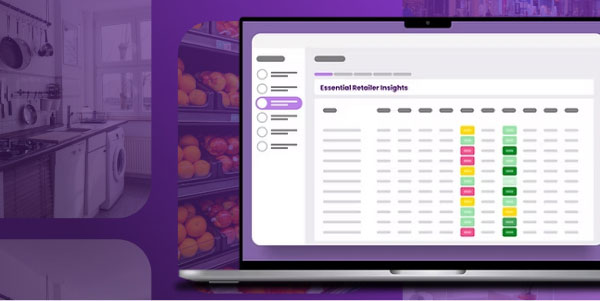
LIQUID DATA™ ESSENTIALS

When Your Data Speaks Retail

See performance the way retailers do without the need for a large team or budget. Built for small and mid-sized suppliers working with major retailers.

Resources

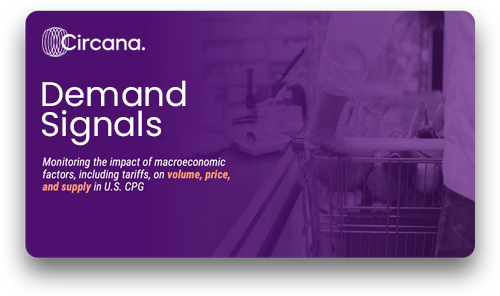
Demand Signals Report

CPG Demand Signals Report

Monitoring the impact of macroeconomic factors, including tariffs, on volume, price, and supply on U.S. consumer behavior within the CPG Industry. 

New strategies and tactics.

Circana's official announcements.

Circana in the press.

Industry rankings vs. previous data period.

See how Circana can help your business grow.

Perspectives from our thought leaders.

A curriculum to address your needs.

Solving challenges that matter to you.

Thought leaders giving growth insights.

Consumer insights and buying trends.

Suggested solutions

Liquid Data Go® helps small to midsize CPG brands grow faster and dream bigger.

Understand complex consumer behavior with clear, accurate insights into omnichan…

See performance the way retailers do without the need for a large team or budget…

Not sure where to start?

Uncover the right solution for your business in a few clicks.

Right Sidebar.jpg

Dictionary Term

Retailers per Household (HH)

Like it? Share it!

TERM

Retailers per Household (HH)

Average number of retailers shopped by each household.

Definition

Measures how many different chains a household visits for a category.

How to Calculate

Divide total retailer visits by number of households.

Why it Matters

High number signals low loyalty.

Key Advantages

Helps target retention tactics.

Example

Average of 3 retailers per HH for snacks.

Use it to

Calculate how many retailers an average household shops within the category. Use this behavior to estimate competitive overlap and switching potential.

View all solutions that

bottom of page