Industries
Industry Rankings
Get the latest rankings, measurements and insights, powered by Liquid AI™.
Circana Unpacked
Listen to the Circana Unpacked podcast featuring thought leaders across our industries.
About Us
Our Team
Careers
Sustainability
REPORTS
GOVERNANCE
Contact
25-34-year-olds are
21%
more likely to drink pumpkin coffees than the average consumer
Quick Insight
It's that time of year again... pumpkin spice is back. 🎃☕
According to Circana, 25–34-year-olds are the most likely to enjoy pumpkin-flavored coffee, proving the season's signature sip is going strong.
Are you team “too early” or “right on time”?
Company

Solutions

Not sure where to start?
Uncover the right solution for your business in a few clicks.
Measure Demand
Track business performance against key competitors at every stage of the product lifecycle.
SOLUTIONS
Accelerate Demand
We help our clients accelerate demand by focusing on the best opportunities for the greatest impact on their business.
Technology
Our Liquid Data® technology provides cross-industry data and advanced analytics in a single, open platform.
Answer the most pressing business questions.
Designed for small CPG businesses.
Curated reports and guided analysis.
Data and analytics for a single source of truth.
LIQUID DATA™ ESSENTIALS
When Your Data Speaks Retail
See performance the way retailers do without the need for a large team or budget. Built for small and mid-sized suppliers working with major retailers.
Resources
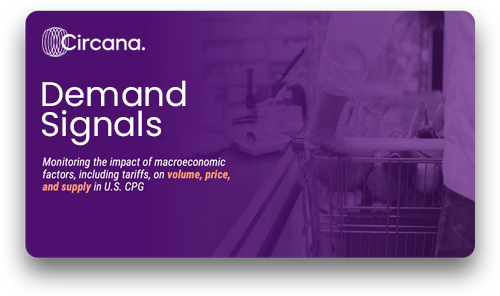
CPG Demand Signals Report
Monitoring the impact of macroeconomic factors, including tariffs, on volume, price, and supply on U.S. consumer behavior within the CPG Industry.
Learn
New strategies and tactics.
Circana's official announcements.
Circana in the press.
Industry rankings vs. previous data period.
See how Circana can help your business grow.
Perspectives from our thought leaders.
A curriculum to address your needs.
Solving challenges that matter to you.
Thought leaders giving growth insights.
Consumer insights and buying trends.
Webinars
FEATURED
Insights Hub
Series
Popular searches
Suggested solutions
Liquid Data Go® helps small to midsize CPG brands grow faster and dream bigger.
Understand complex consumer behavior with clear, accurate insights into omnichan…
See performance the way retailers do without the need for a large team or budget…
Liquid Data Go ROI Calculator
Drive growth and lead the market
Win and keep shelf space
Stay ahead of consumer needs
Find and target the right buyers
Accelerate E-commerce growth
Make pricing your growth engine
Real answers from real buyers
Automate and scale business analysis
An SMB Playbook for Leakage Analysis and Recovery in 90 Days
Insights and practical guides
Estimate potential savings
Key industry metrics explained
R
Breakdown of sales by retail channel.
S
Revenue split by geographic region.
Revenue split by retailer.
Total sales volume of stores, used to weight distribution and reach.
Sales normalized by distribution points.
Products that frequently appear together in a single shopping basket.
Letting shoppers try products before buying.
An identifier used to link stores or media zones in datasets.
A what-if case for planning or testing.
Regular patterns in demand across the year.
Additional placements beyond the main shelf.
Percentage of a shopper’s category spend captured by your brand.
Price shown on the shelf tag.
Temporary cuts from the shelf price.
Marketing focused on the path to purchase.
How quickly a product or campaign launches.
Average dollars each buying household spends on the brand in a period.
A geographic label used in retail or media reporting.
A longitudinal panel of the same households over time.
Matching a new store to the closest peer group for forecasting.
View all solutions that